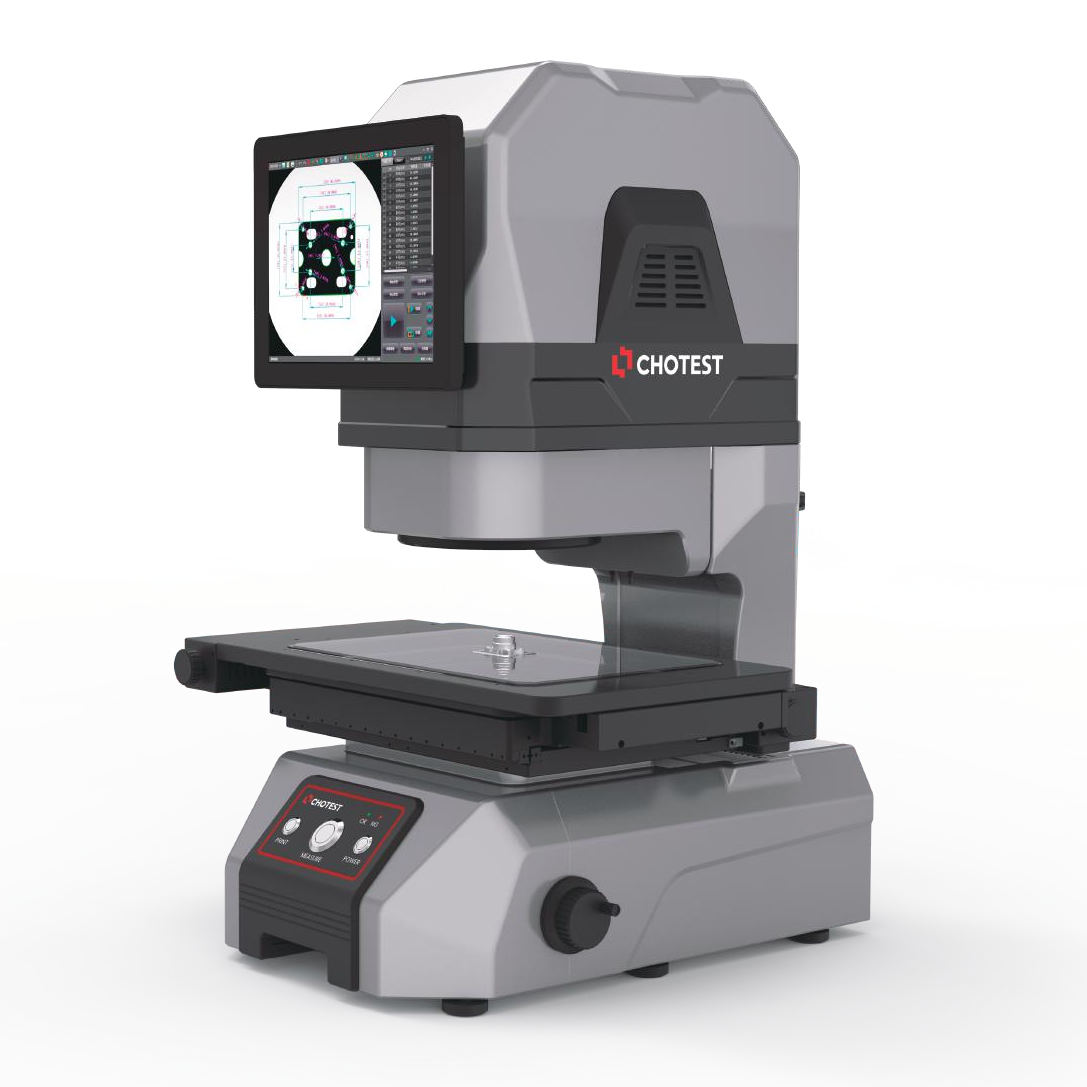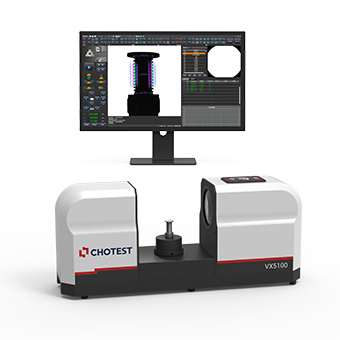

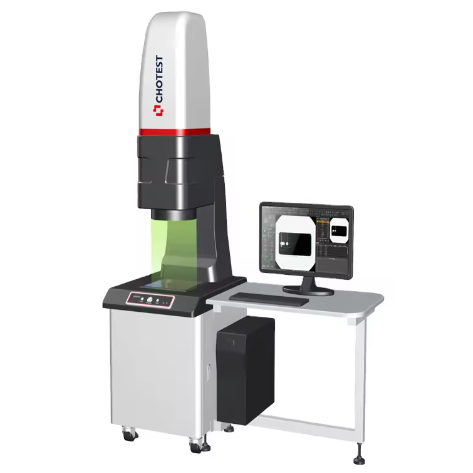
VX4230S
Based on the principle of machine vision measurement and high-precision image analysis algorithms, the VX4000 series instant measuring machines, equipped with double telecentric optical lenses with large depth of field, allow for rapid dimensional measurements by a single click operation.
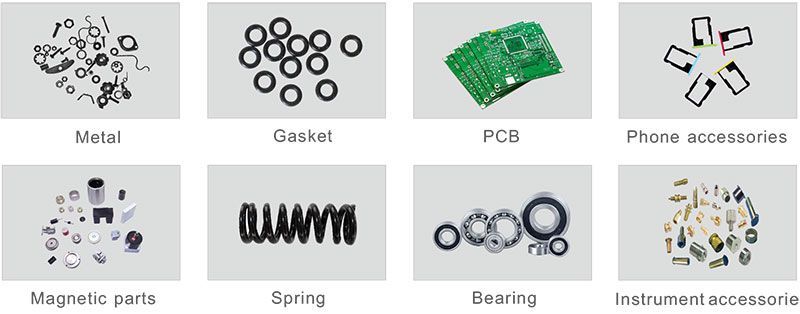
The VX4000 series is suitable for high-precision dimensional measurement in sectors such as machinery, electronics, molds, plastic injection, hardware, rubber, low-voltage electrical equipment, magnetic materials, precision stamping, connectors and terminals, mobile phones, household appliances, printed circuit boards, medical devices, watchmaking, cutting tools, and more.
- Image sensor: 25MP CMOS
- Field of view: φ230 mm
- Depth of field: 50 mm
- Working distance: 400m
- Resolution: 0.1 μm
- Dimensions (length x width x height): 830 × 605 × 1500 mm
- Weight: 375 kg
| Features | |
|---|---|
| Model | VX4230S |
| Image Sensor | 25MP CMOS |
| Monitor | 24" LCD (XGA:1920×1080) |
| Acceptance Lens | Double Telecentric Lens |
| Parallel transmission illumination(White Light) | |
| F.O.V. | Φ230mm |
| Depth of Field | 50mm |
| Working Distance | 400mm |
| Repeatability | ±2um |
| Accuracy of Image Meas.* | ±5um |
| Z-Axis Travel range | 65mm |
| Software | VisionX |
| Resolution | 0.1um |
| Loading Capacity | 15kg |
| Size(LxWxH) | 830*605*1500mm |
| Weight | 375kg |
| Input | AC100~240V,50/60Hz,4A,600W |
| Working Environment | Temp.10℃-35℃, Humidity 20%~80%, Vibration<0.002g, Less than 15Hz |
Observations:
*1 In the focusing position, the ambient temperature is 20 °C ± 1.0 °C
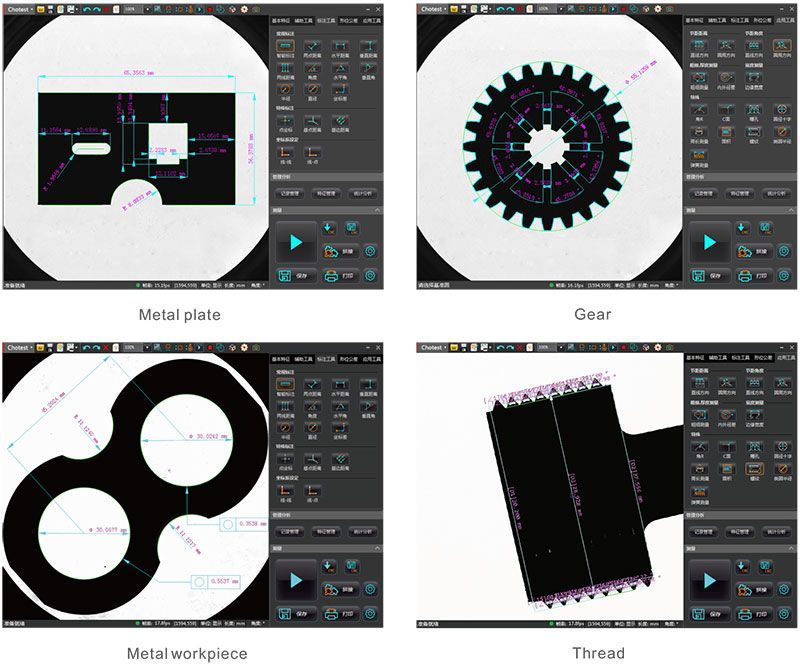
Applications
VisionX software incorporates up to 80 extraction and analysis tools, including:
- Feature extraction (maximum points, center lines, arcs, peaks, etc.).
- Auxiliary tools (creation of points, lines and circles, adjustment of lines, adjustment of circles, tangencies, inscribed circles, etc.).
- Smart labeling.
- Shape tolerances.
- Specific application tools (pitch distance and angle, grooves, threads, circular sections, inclination angles, rounding, etc.).
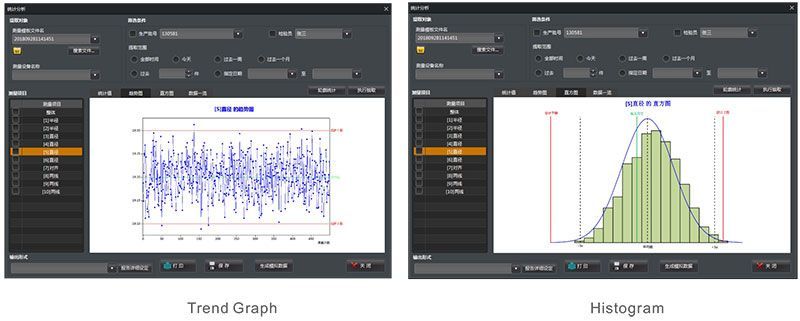
Measurement results and their main statistical values (such as mean, σ, 3σ, 6σ, Ca, Cp, Cpk, among others) are automatically recorded and archived. In addition, operators can select different filtering conditions for extracting and analyzing historical data.
Statistics
The trend chart shows the typical evolution of measured values, such as monotonic or periodic changes, and can be used to monitor potential anomalies in the production process or manufacturing equipment. The histogram reflects the status and distribution of fluctuations in product quality, allowing for an intuitive visualization of the quality situation during the production process, as well as predicting product quality and failure rates.
Through diagnosis and quality analysis using statistical methods, SPC allows monitoring of product quality and the evolution of the production process.
Thanks to SPC, it's possible to implement preventative solutions during the production process, reducing subsequent inspections and repairs. As a result, better control of the manufacturing process and continuous improvement in product quality are achieved.
More apps
You may also be interested in: