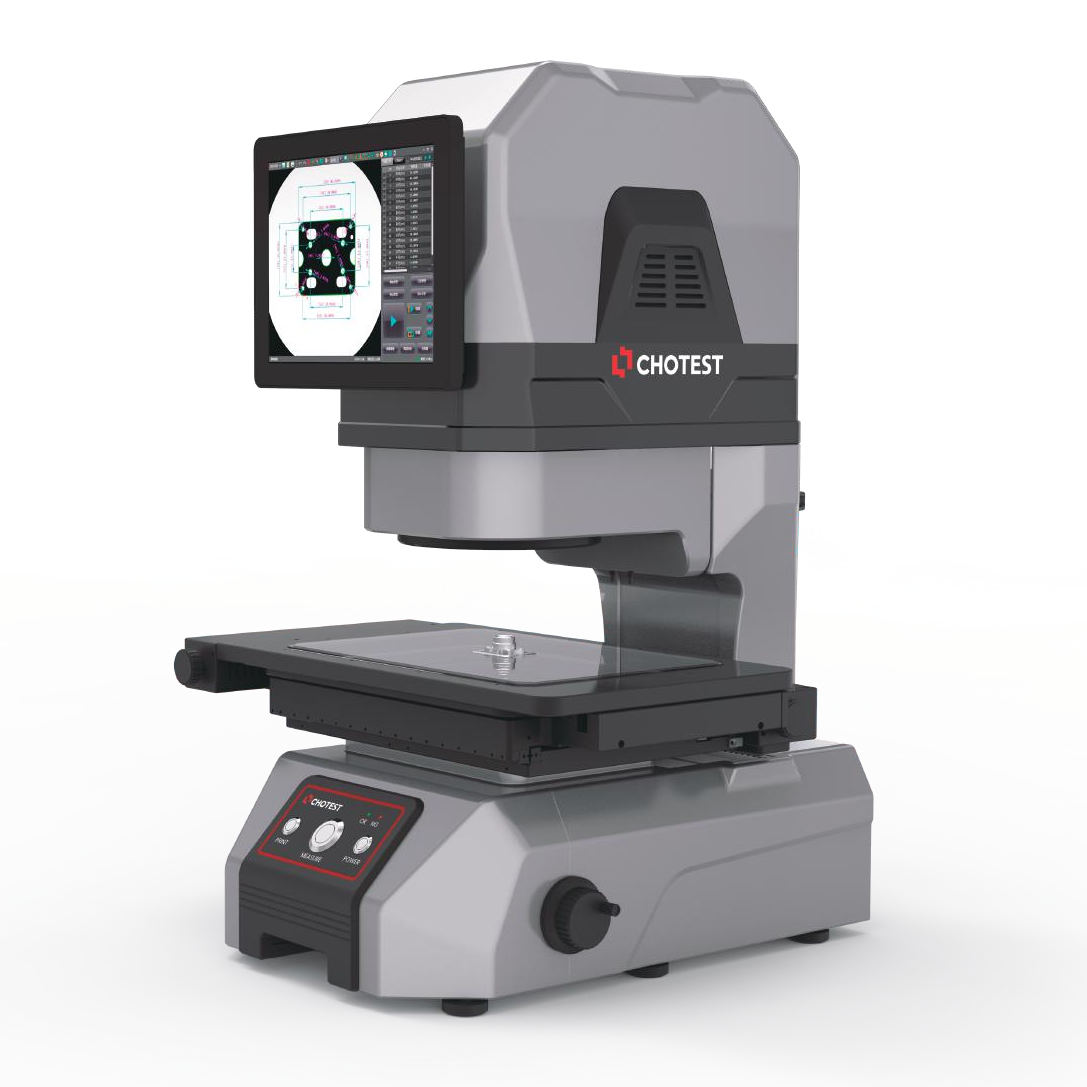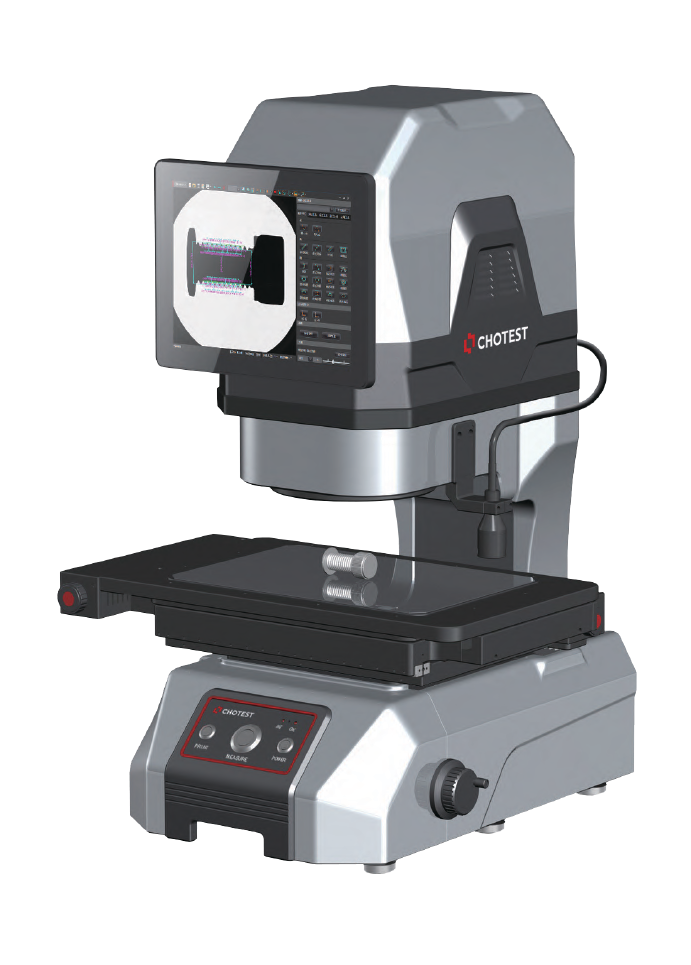

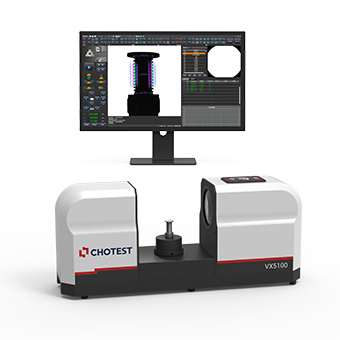
VX5100
VisionX professional visual measurement software
VisionX professional visual measurement software has been developed entirely by CHOTEST, which holds the independent intellectual property rights. VisionX features an intuitive user interface, easy operation, and powerful, practical functions. It integrates over 80 extraction and analysis tools, including feature extraction tools, auxiliary tools, annotation tools, and specialized applications.
Furthermore, the functions can be customized according to the user's needs, with the aim of effectively improving operational efficiency.
| Features | |
|---|---|
| Model | VX5100 |
| Image Sensor | 5MP CMOS |
| Outside Monitor | 24" LCD (XGA:1920×1080) |
| Acceptance Lens | Double Telecentric Lens |
| Back Light | Telecentric transmission illumination |
| F.O.V. | Φ100mm |
| Repeatability | ±2um |
| Accuracy *1 | ±5um |
| Software | VisionX |
| Resolution | 0.1um |
| XY Obejct Table(Optional) | Retational Speed 0,2 Revolution/s |
| Diameter Φ60mm | |
| Capacity 3kg | |
| Size(LxWxH) | 736×200×325mm |
| Weight | 25kg |
| Input | AC100~240V,50/60Hz,1.3A,150W |
| Working Environment | Temp.10 °C~35 °C, Humidity 20~80%, Vibration<0.002g, Less than 15Hz |
Observations:
* 1 In the focusing position, the ambient temperature is 20 °C ± 1.0 °C
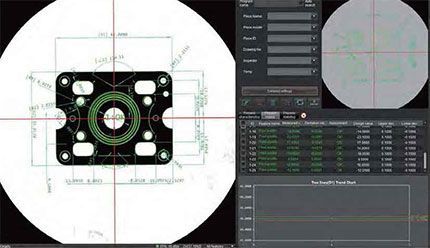
General characteristics
Geometric tolerances
Straightness, roundness, concentricity, symmetry, position tolerance, parallelism, perpendicularity, profile tolerance, among others.
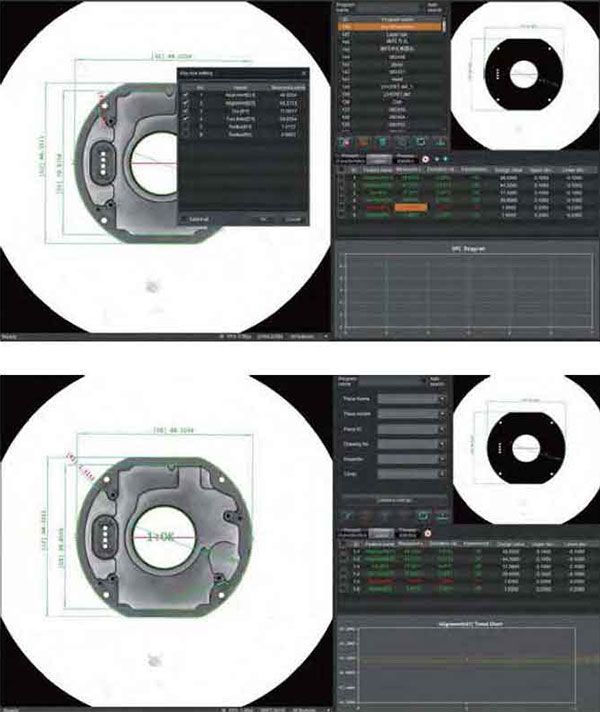
CNC mode
It allows you to modify CNC programs at any time, as well as add or remove features. The OK or NG result is automatically determined based on the tolerances set in the program.
Automation
Simply select the measurement characteristics. After placing the part, the results are obtained quickly with a single click.
Coordinate system
It allows you to create coordinate systems using point-line or line-line, as well as perform translations and rotations, and even generate multiple reference systems.
Specific tools
Roundings, contours, threads, grooves, perimeters, pitch distance, thicknesses, chamfers, springs, gears, sealing gaskets, areas, pitch angle and contour width.
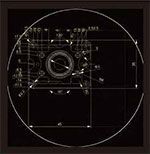
DXF Import
Measurement data can be obtained directly from CAD drawings. Even if the physical part is unavailable, measurement programs can be created quickly. The system automatically maps features and dimensions from the DXF file to the sample, including surface dimensions.
Sample
Automatically assigns DXF characteristics to the sample
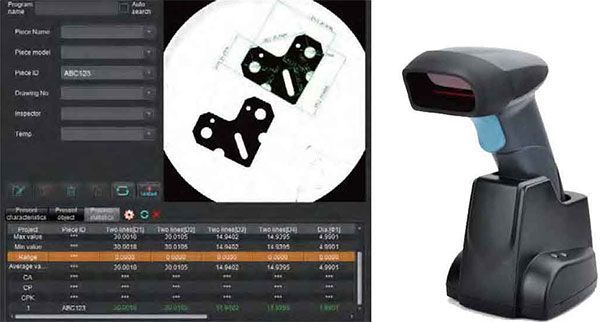
CNC Measurement
Barcode scanner
The value read by the scanner can be stored as inspection information or used to search for measurement programs according to the operator's settings.
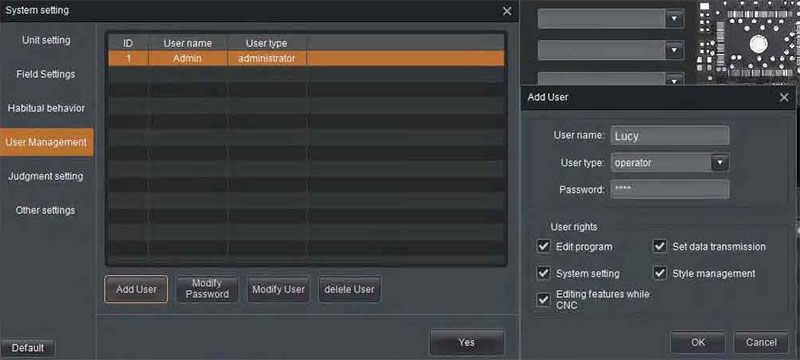
User management
Accounts can be configured as administrator or operator. Operator permissions can be restricted according to the needs of the process.
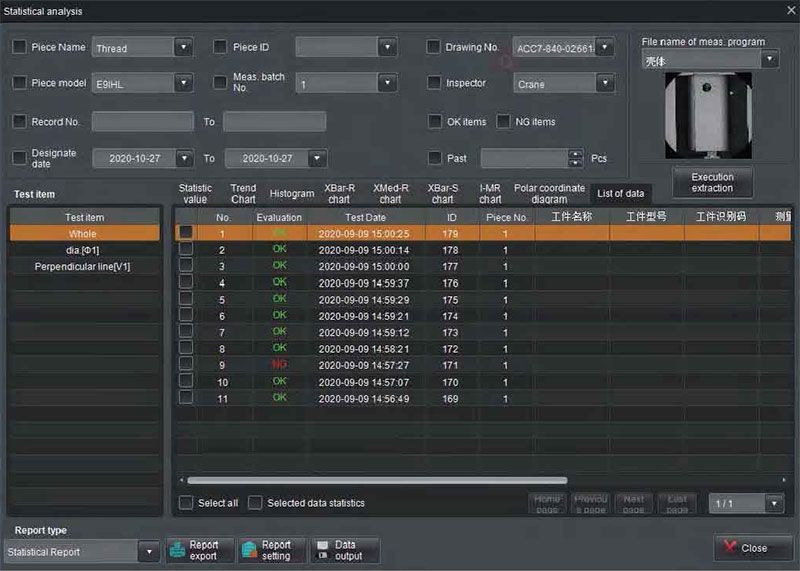
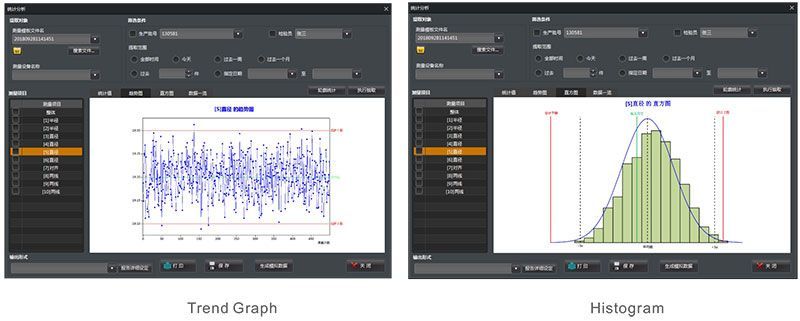
Statistical analysis
The interface includes tabs for:
- Statistical values
- Trend charts
- Histograms
- List of data
Automatic registration and classification
Measurement results and their main statistical parameters (mean, σ, 3σ, 6σ, Ca, Cp, Cpk, etc.) are automatically recorded and stored. Operators can perform searches based on various criteria.
Statistics
Tabulated data
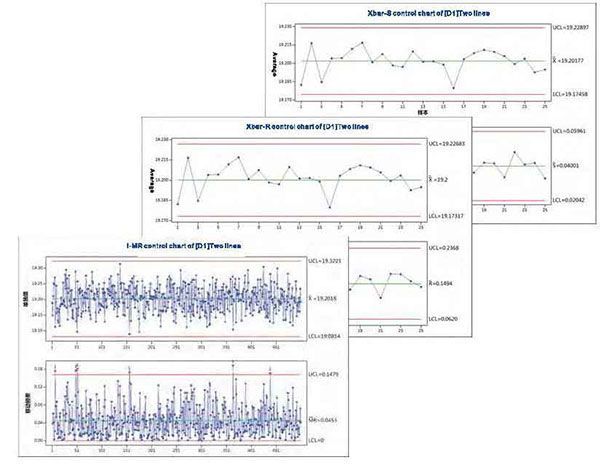
Control of the production process and improvement of quality
The trend chart allows for monitoring anomalies in equipment and production processes based on the evolution of measured values, including monotonic and periodic changes. The histogram reflects the fluctuation and distribution of product quality, providing key process information for evaluating and predicting quality and non-conformity rates.
Through diagnostics and quality analysis, SPC methods not only allow monitoring of product quality, but also identify process trends, reduce waste from subsequent inspections, and improve process control and final quality.
Through diagnosis and quality analysis, the SPC statistical method can not only monitor product quality, but also reflect the trend of change in the generation process, reduce waste caused by post-inspection, in order to achieve the effect of controlling the production process and improving product quality.
Automatic report generation
With just one action it is possible:
- Import and export measurement records.
- Save reports in PDF, CSV, Excel, and text formats.
- Use custom PDF templates.
- Use custom Excel templates.
- Export and print reports quickly.
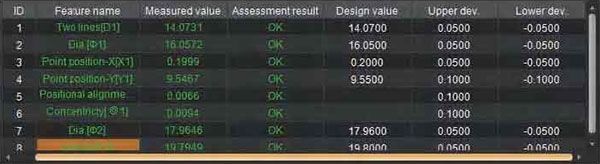
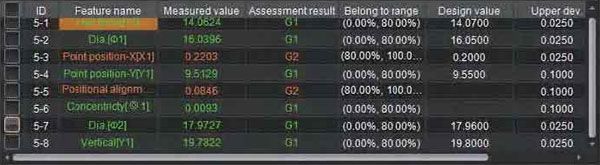
Evaluation methods
Standard tolerance
Evaluation of the measured values against the design value and the upper and lower tolerances specified in the drawing.
Degree of tolerance
Division of tolerance into different levels according to the deviation range. Allows for sample classification to facilitate assembly and reduce waste. Evaluation of measured values against the design value and the upper and lower tolerances specified in the drawing.
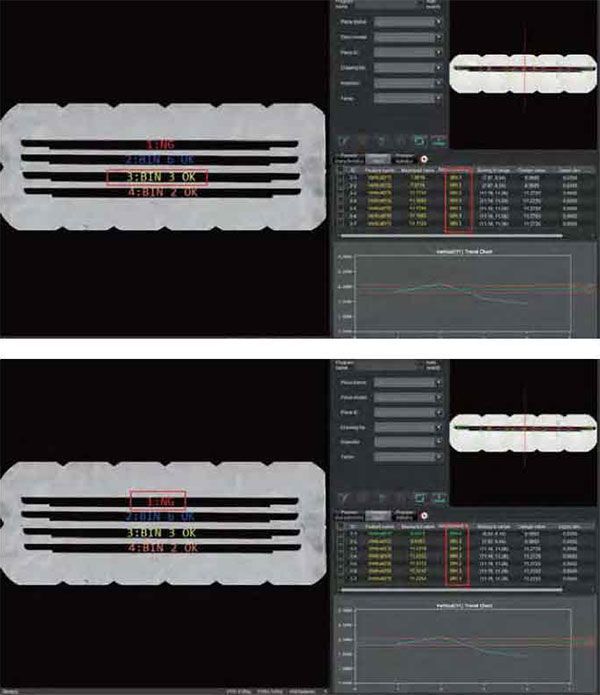
Tolerance ratio
Classification based on the tolerance percentage to generate early alerts about the condition of the equipment.
critical dimensions
The conformity of the sample is determined solely by the critical dimensions defined by the operator.
Data
Data management
Reports can be generated quickly and easily in PDF, Word, Excel, CSV, and TXT formats.
Process statistics
Automatic calculation of Cp and Cpk, with real-time visualization using trend graphs and histograms.
Custom Excel reports
Measurement data, inspection images, and associated information are automatically exported to predefined Excel templates.
| Lot No. | Article | Measurement value | Design value | Upper limit | Lower limit | Inspector | Date |
|---|---|---|---|---|---|---|---|
| D8X62723-E75-PN-1 | L① | 2.513 | 2.5 | 0.2 | -0.2 | Crane | 09.20 |
| D8X62723-E75-PN-1 | L② | 2.512 | 2.5 | 0.2 | -0.2 | Crane | 09.20 |
| D8X62723-E75-PN-1 | L③ | 2.511 | 2.5 | 0.2 | -0.2 | Crane | 09.20 |
| D8X62723-E75-PN-1 | L4 | 2.508 | 2.5 | 0.2 | -0.2 | Crane | 09.20 |
| D8X62723-E75-PN-1 | L⑤ | 2.509 | 2.5 | 0.2 | -0.2 | Crane | 09.20 |
| D8X62723-E75-PN-1 | L⑥ | 2.511 | 2.5 | 0.2 | -0.2 | Crane | 09.20 |
| D8X62723-E75-PN-1 | L⑦ | 2.513 | 2.5 | 0.2 | -0.2 | Crane | 09.20 |
| D8X62723-E75-PN-1 | L⑧ | 2.512 | 2.5 | 0.2 | -0.2 | Crane | 09.20 |
| D8X62723-E75-PN-1 | L⑨ | 2.509 | 2.5 | 0.2 | -0.2 | Crane | 09.20 |
| D8X62723-E75-PN-1 | L① | 1.999 | 2 | 0.3 | -0.1 | Crane | 09.20 |
| D8X62723-E75-PN-1 | L② | 1.997 | 2 | 0.3 | -0.1 | Crane | 09.20 |
| D8X62723-E75-PN-1 | L③ | 1.998 | 2 | 0.3 | -0.1 | Crane | 09.20 |
| D8X62723-E75-PN-1 | L4 | 1.997 | 2 | 0.3 | -0.1 | Crane | 09.20 |
| D8X62723-E75-PN-1 | L⑤ | 1.997 | 2 | 0.3 | -0.1 | Crane | 09.20 |
| D8X62723-E75-PN-1 | L⑥ | 1.999 | 2 | 0.3 | -0.1 | Crane | 09.20 |
| D8X62723-E75-PN-1 | L⑦ | 1.996 | 2 | 0.3 | -0.1 | Crane | 09.20 |
| D8X62723-E75-PN-1 | L⑧ | 1.999 | 2 | 0.3 | -0.1 | Crane | 09.20 |
| D8X62723-E75-PN-1 | L⑨ | 1.997 | 2 | 0.3 | -0.1 | Crane | 09.20 |
| D8X62723-E75-PN-1 | L① | 0.901 | 0.9 | 0.1 | -0.1 | Crane | 09.20 |
| D8X62723-E75-PN-1 | L② | 0.904 | 0.9 | 0.1 | -0.1 | Crane | 09.20 |
| D8X62723-E75-PN-1 | L③ | 0.904 | 0.9 | 0.1 | -0.1 | Crane | 09.20 |
| D8X62723-E75-PN-1 | L4 | 0.903 | 0.9 | 0.1 | -0.1 | Crane | 09.20 |
| D8X62723-E75-PN-1 | L⑤ | 0.902 | 0.9 | 0.1 | -0.1 | Crane | 09.20 |
| D8X62723-E75-PN-1 | L⑥ | 0.905 | 0.9 | 0.1 | -0.1 | Crane | 09.20 |
| D8X62723-E75-PN-1 | L⑦ | 0.901 | 0.9 | 0.1 | -0.1 | Crane | 09.20 |
| D8X62723-E75-PN-1 | L⑧ | 0.903 | 0.9 | 0.1 | -0.1 | Crane | 09.20 |
| D8X62723-E75-PN-1 | L⑨ | 0.901 | 0.9 | 0.1 | -0.1 | Crane | 09.20 |
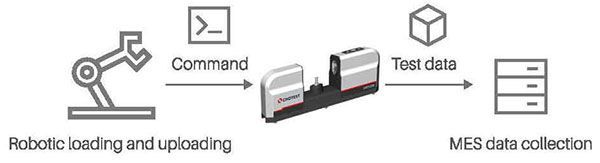
TCP
Measurement data is transmitted to the customer's MES system via socket or HTTP protocols in real time.
VisionX could also receive commands from the external server to load the program and start the measurement, making it compatible with robotic arms to achieve unmanned measurements.
QDAS
Automatic generation of results in a format compatible with QDAS systems. K fields can be customized to link VX devices with output parameters.

Custom text reports
The operator can define the content format and export the data in real time.

Advanced features
Smart Annotation
It allows you to record distances between points, lines, circles, and other geometric combinations.
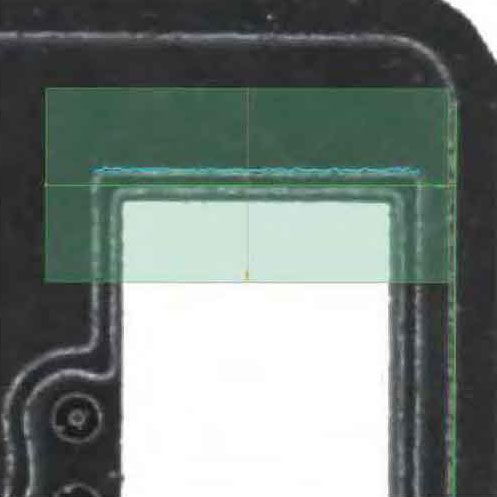
Automatic edge detection
The system automatically identifies edges after the region of interest is selected. Conditions can be configured to eliminate interference and accurately extract features, even on very small contours.
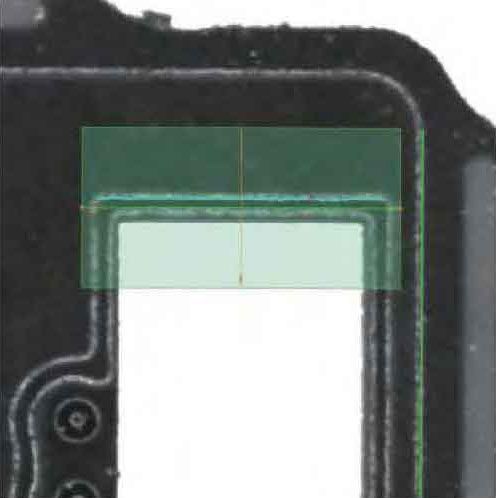
Extract from dark to bright
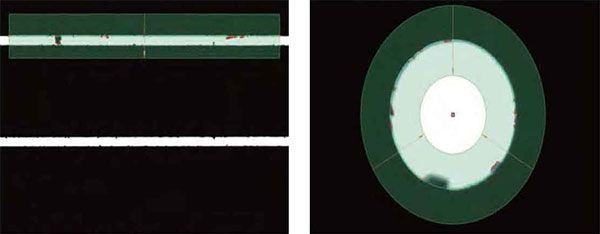
Extract from light to dark
Automatic deburring
Eliminates anomalous spots and burr interference for accurate feature extraction.
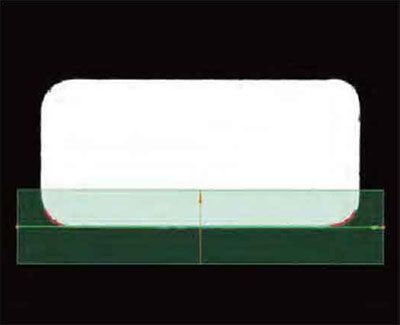
Orientation adjustment
The orientation of the selection area is automatically adjusted to ensure measurement accuracy, even under complex conditions.
Orientation adjustment
The orientation of the selection area is automatically adjusted to ensure measurement accuracy, even under complex conditions.
More apps
Flash measuring machines are widely used in the machinery, electronics, mold, injection molding, hardware, rubber, low voltage appliances, magnetic materials, precision stamping, connectors, plugs, terminals, mobile phones, household appliances, printed circuit boards, medical equipment, watches, tools, etc. industries.
You may also be interested in: